
Black Hole Parameter Inference from EHT Observations#
Background#
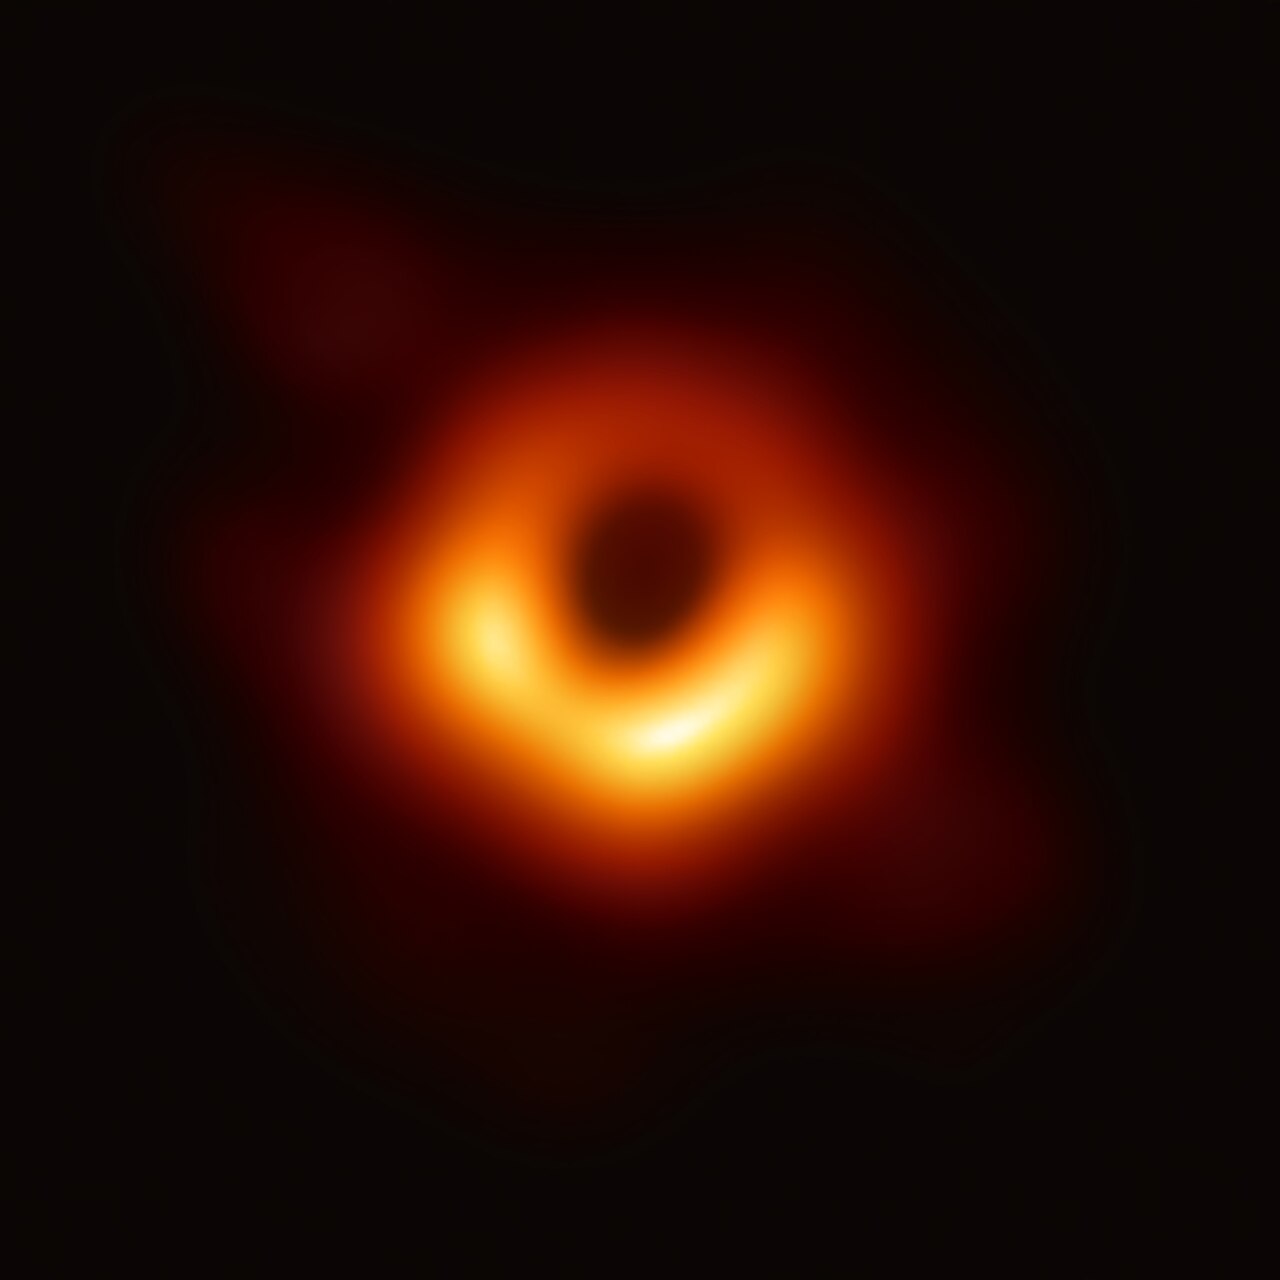
The Event Horizon Telescope (EHT) is a global network of radio telescopes that uses very-long-baseline interferometry (VLBI) to reach an angular resolution sufficient to resolve the shadow of a supermassive black hole. In 2019 the EHT Collaboration released the first image of the black hole in Messier 87 (M87*) [1], and in 2022 the first image of Sagittarius A* (Sgr A*), the black hole at the centre of the Milky Way [2].
The appearance of a black hole image depends on several physical parameters, including:
the black hole spin \(a\): the dimensionless angular momentum (\(-1 \leq a \leq 1\)), which affects the asymmetry of the ring;
the viewing inclination \(i\): the angle between the observer’s line of sight and the black hole spin axis;
the mass accretion rate \(\dot{M}\): which controls the overall brightness;
the electron temperature prescription: a parameter governing how thermal energy is partitioned between ions and electrons in the accretion flow.
To interpret EHT observations, researchers use computationally expensive general relativistic magnetohydrodynamic (GRMHD) simulations, coupled with general relativistic radiative transfer (GRRT) codes, to produce synthetic images of black holes across a range of physical parameters [3]. Comparing these simulated images with the observations constrains the underlying black hole parameters.
Machine learning has emerged as a promising tool for this parameter-estimation task, offering large speed-ups over traditional pipelines [4], [5]. For example, convolutional neural networks can recover parameters such as the mass and accretion rate from simulated images, although recovering the spin remains challenging at current EHT resolution [4].
Looking beyond this project, physics-informed neural networks (PINNs) [6] offer the possibility of embedding known physics (e.g. the Kerr metric, the geodesic equations, radiative transfer) directly into the learning process.
Overview#
This notebook has four goals:
understanding the physics of black hole imaging and the EHT;
working with real EHT observational data using the
ehtimlibrary;applying dimensionality reduction (PCA) to simulated black hole images; and
training a CNN to predict black hole image parameters, and finding out what happens when it meets real data.
Questions (Conceptual)#
Question 01#
What is the Event Horizon Telescope, and how does interferometry allow a collection of telescopes to achieve the angular resolution of an Earth-sized dish? Estimate the resolution \(\sim\lambda/D\) for \(\lambda = 1.3\) mm and \(D \approx\) the Earth’s diameter, in microarcseconds (µas). [1]
# Your answer here
Question 02#
Briefly describe the key physical parameters that determine the appearance of a black hole shadow image (spin \(a\), inclination \(i\), mass accretion rate \(\dot{M}\), electron temperature prescription \(T_{e}\)). Which of these do you expect to have the strongest visual signature in the image, and why?
# Your answer here
Question 03#
What is a GRMHD simulation, and why are large libraries of simulated images important for training ML models on black hole data? What are some limitations of relying on simulated training data when applying models to real EHT observations? [3], [4]
# Your answer here
Data Sources#
We will work with two types of data in this project:
Real EHT observations: the publicly released Science Release 1 (SR1) data from the 2017 EHT observations of M87* [7], which were used to produce the first image of a black hole. The data are in
uvfitsformat, the standard for VLBI data, and contain the complex visibilities measured on the baselines between pairs of telescopes.Simulated observations: using the
ehtimlibrary [8], we generate synthetic observations of parameterized black hole models with the same \((u,v)\) coverage as the real EHT array. This gives us labelled training data, for which the true parameters are known.
The ehtim (eht-imaging) library is an open-source Python package for loading, simulating and imaging VLBI data. It was one of the three imaging pipelines used to produce the published M87* images [9].
Installing ehtim and Downloading Data#
%pip install --quiet ehtim
# Clone the EHT SR1 public data release
import os
if not os.path.exists('2019-D01-01'):
    !git clone --depth 1 https://github.com/eventhorizontelescope/2019-D01-01.git
print("EHT SR1 data files:")
for f in sorted(os.listdir('2019-D01-01/uvfits')):
    if f.endswith('.uvfits'):
        print(f"  {f}")
The SR1 data release contains calibrated Stokes I visibilities for M87* from four observing days in April 2017 (April 5, 6, 10, 11 — corresponding to day-of-year 095, 096, 100, 101), each with a low-band and high-band frequency channel at ~227 GHz. These are the exact data used in the original EHT M87 publications.
Loading and Exploring the Real EHT Data#
In this section we show one way to load and explore data from ehtim’s official tutorial. This is a standard way of using ehtim. You can find those tutorials here.
import ehtim as eh
import numpy as np
import matplotlib.pyplot as plt
import warnings
warnings.filterwarnings('ignore')

# Load a single observation day (April 6, 2017 — day 096, low band)
obs = eh.obsdata.load_uvfits('2019-D01-01/uvfits/SR1_M87_2017_096_lo_hops_netcal_StokesI.uvfits')

print(f"Source: {obs.source}")
print(f"Frequency: {obs.rf/1e9:.2f} GHz")
print(f"MJD: {obs.mjd}")
print(f"Number of visibilities: {len(obs.data)}")
print(f"Telescopes: {obs.tarr['site']}")
# Plot the (u,v) coverage — this shows the Fourier plane sampling
# Each point represents a baseline measurement between two telescopes
# The gaps in coverage are why image reconstruction is challenging

obs.plotall('u','v', conj=True, show=False, export_pdf='')
plt.title('(u,v) Coverage of EHT 2017 M87 Observation (Day 096)')
plt.xlabel(r'u (G$\lambda$)')
plt.ylabel(r'v (G$\lambda$)')
plt.show()
Question 04#
Referring to the previous example, plot the visibility amplitudes as a function of uv-distance for the loaded
EHT observation (hint: look at obs.plotall()).
What structure do you notice, and what does it tell you about the source morphology?
# Your code here
Question 05#
Construct a dirty image and dirty beam (PSF) from the real M87* data
using obs.dirtyimage() and obs.dirtybeam() with npix=64 and a field of view
of 200 \(\mu\)as (fov = 200 * eh.RADPERUAS). Plot them side by side.
What does the dirty beam tell you about the EHT’s resolving power and sidelobe structure? You should find the tutorials linked previously helpful.
# Your code here
Generating Labeled Training Data#
To train a machine-learning model we need labelled data: images with known physical parameters. The real EHT data have only one target (M87*), whose parameters are uncertain, so we generate synthetic training data with ehtim.
The approach:
Create parameterized black hole models (“crescents”) with varying parameters.
“Observe” each model with the same \((u,v)\) coverage as the real EHT array, i.e. convolve it with the dirty beam of the real observation. This is exactly the dirty image that would be obtained from perfectly calibrated visibilities.
Add realistic thermal noise. We obtain it by simulating noise-only observations with
ehtim, using the real per-visibility uncertainties, and imaging them. Note that this noise is correlated between pixels, because it is shaped by the dirty beam.
This mirrors the approach used in EHT analyses, in which model or GRMHD images are forward-modelled through the observation pipeline to create synthetic data for comparison [3], [9].
We parameterize our simple model with:
the crescent asymmetry \(\xi \in [0.01, 0.99]\), which controls the brightness asymmetry (a proxy for the Doppler beaming set by the spin and inclination);
the ring diameter \(d \in [30, 60]\) µas, which is related to the black hole mass \(M\) and distance \(D\): the shadow diameter is \(\approx 2\sqrt{27}\,GM/(c^2 D) \approx 10.4\,GM/(c^2 D)\);
the position angle \(\phi \in [0°, 360°]\), the orientation of the crescent on the sky;
the total flux \(F \in [0.3, 1.5]\) Jy, a proxy for the accretion rate.
This simplified model does not capture the full complexity of GRMHD simulations. However, it is the same class of geometric model used in the EHT’s own early parameter estimates [9].
# Generate a dataset of simulated dirty images (calibrated data + thermal noise)
np.random.seed(42)
N_samples = 2000
npix = 64
fov = 200 * eh.RADPERUAS

obs_template = eh.obsdata.load_uvfits('2019-D01-01/uvfits/SR1_M87_2017_096_lo_hops_netcal_StokesI.uvfits')

# Dirty beam (PSF) of the real (u,v) coverage
psf = obs_template.dirtybeam(npix, fov).imvec.reshape(npix, npix)
psf_fft = np.fft.fft2(np.fft.ifftshift(psf))

def crescent_image(flux, d, xi, pa):
    """ehtim image of a crescent with total flux (Jy), diameter d (uas), asymmetry xi, position angle pa (deg)."""
    im = eh.image.make_square(obs_template, npix, fov)
    Rp = d * eh.RADPERUAS / 2.0
    Rn = Rp * (1 - xi * 0.5)
    im = im.add_crescent(flux, Rp, Rn, Rp * xi * 0.3 * np.cos(np.radians(pa)), Rp * xi * 0.3 * np.sin(np.radians(pa)))
    im.imvec = np.nan_to_num(im.imvec)
    return im

# Thermal-noise images: observe a (nearly) empty sky with the real per-visibility noise, then image it
empty = crescent_image(1e-9, 40, 0.5, 0)
noise_bank = np.array([empty.observe_same(obs_template, add_th_noise=True, ttype='direct', verbose=False)
                       .dirtyimage(npix, fov).imvec.reshape(npix, npix) for _ in range(10)])
print(f"thermal noise in the dirty image: std = {noise_bank.std():.2e} (image units)")

asymmetries = np.random.uniform(0.01, 0.99, N_samples)
diameters   = np.random.uniform(30, 60, N_samples)      # uas
pos_angles  = np.random.uniform(0, 360, N_samples)      # deg
fluxes      = np.random.uniform(0.3, 1.5, N_samples)    # Jy

images = np.zeros((N_samples, npix, npix), dtype=np.float32)
for idx in range(N_samples):
    model = crescent_image(fluxes[idx], diameters[idx], asymmetries[idx], pos_angles[idx]).imvec.reshape(npix, npix)
    dirty = np.real(np.fft.ifft2(np.fft.fft2(model) * psf_fft))         # convolve with the dirty beam
    images[idx] = dirty + noise_bank[np.random.randint(len(noise_bank))]  # add a thermal-noise realization

print(f"Dataset generated: {images.shape}; typical peak / noise = {np.median(images.max(axis=(1, 2))) / noise_bank.std():.0f}")
# Visualize a few simulated images
fig, axes = plt.subplots(3, 3, figsize=(10, 10))
extent = [-fov/eh.RADPERUAS/2, fov/eh.RADPERUAS/2,
          -fov/eh.RADPERUAS/2, fov/eh.RADPERUAS/2]

for idx, ax in enumerate(axes.flat):
    ax.imshow(images[idx], cmap='afmhot', origin='lower', extent=extent)
    ax.set_title(f'$\\xi$={asymmetries[idx]:.2f}, d={diameters[idx]:.0f}$\\mu$as',
                 fontsize=10)
    ax.set_xlabel(r'$\Delta$RA ($\mu$as)')
    ax.set_ylabel(r'$\Delta$Dec ($\mu$as)')

plt.suptitle('Simulated Black Hole Shadow Images (Dirty Images)', fontsize=14)
plt.tight_layout()
plt.show()
Dimensionality Reduction#
Principal Component Analysis (PCA) is a useful tool for understanding the dominant modes of variation in high-dimensional data. For images, PCA finds the directions in pixel space that capture the most variance. Each principal component can be reshaped back into an image and interpreted as an “eigenimage”, a pattern of variation across the dataset.
This technique has direct relevance to EHT science: the PRIMO algorithm [10] that produced the sharpened M87* image is fundamentally a PCA-based method. It learns a basis of principal components from a training set of GRMHD images and uses them to reconstruct the observed data at higher fidelity.
Questions (Dimensionality Reduction)#
Question 06#
Perform PCA on the flattened image dataset (each image reshaped into a 1D vector). Centre the data by subtracting the mean image before fitting. Plot the explained variance ratio as a function of the number of components. How many components are needed to capture 90% of the total variance? Visualize the first several principal components reshaped back into images, and interpret them in terms of the model parameters (diameter, flux, asymmetry, position angle).
# Your code here
# from sklearn.decomposition import PCA # Helpful PCA library
CNN for Black Hole Parameter Prediction#
PCA is linear. To extract a parameter such as the diameter from images, a nonlinear method is natural. Convolutional neural networks have been applied to black hole parameter estimation in several studies, including:
Deep Horizon [4]: a Bayesian deep CNN for regression of the viewing angle, accretion rate and mass, plus a classification network for the spin.
PRIMO [10]: a PCA-based method trained on GRMHD images, which produced a sharper M87* image by filling in gaps in the Fourier coverage.
Polarimetric observables [5]: random forests and other ML methods applied to spatially resolved polarimetric features, to infer properties of the accretion flow.
VLBInet [11]: neural networks applied directly to visibility-domain data, to classify the accretion state (MAD vs. SANE).
Questions (CNN Prediction)#
Question 07#
Design and implement (in PyTorch) a convolutional neural network that predicts the crescent diameter \(d\) (in µas) from the simulated dirty images. Use an 80/20 train/test split.
Think about preprocessing. Should the network see the total flux, or should you normalize each image (e.g. by its peak) so that it learns the shape? How does that affect what you can apply it to later?
Report the test RMSE. Plot predicted vs. true diameter for the test set, and show the training and validation loss curves.
Compare the RMSE with the spread of the diameters in the training set. Is the CNN doing better than simply predicting the mean?
# Your code here
# Some helpful libraries
# import torch
# import torch.nn as nn
# import torch.optim as optim
# from torch.utils.data import DataLoader, TensorDataset
From simulations to real data#
The simulated images above assume perfectly calibrated visibility phases. In a real VLBI observation, each telescope sees the signal through a different, rapidly changing atmosphere, and has its own clock and instrumental errors. These multiply every visibility on baseline \((i, j)\) by station-based gains, \(V_{ij}^\mathrm{obs} = g_i\, g_j^*\, V_{ij}^\mathrm{true}\). The visibility phases of the released M87* data are therefore not reliable on their own. The EHT imaging pipelines rely instead on closure quantities and self-calibration [7], [9]. For example, the closure phase, the sum of the visibility phases around a triangle of three telescopes, is immune to station-based phase errors [12].
The function below simulates an observation of a model image through the full ehtim pipeline, with random station phase errors, and returns its dirty image. (Each call takes a few seconds.)
def phase_corrupted_dirty_image(flux, d, xi, pa):
    """Dirty image of a crescent observed with the real (u,v) coverage, thermal noise, and random station phases."""
    model = crescent_image(flux, d, xi, pa)
    obs_sim = model.observe_same(obs_template, add_th_noise=True, phasecal=False, ampcal=True, ttype='direct', verbose=False)
    return obs_sim.dirtyimage(npix, fov).imvec.reshape(npix, npix)
Question 08#
Domain shift.
Generate a test set of about 50 phase-corrupted dirty images with random parameters, using
phase_corrupted_dirty_image. Plot a few of them next to the calibrated simulations, and next to the real M87* dirty image from Question 05. Which do the real data resemble?Apply your CNN from Question 07 to the phase-corrupted test set (with the same preprocessing). Plot predicted vs. true diameter, and compute the RMSE and the correlation coefficient. Does the network still work? Where do its predictions cluster, and why?
Now apply the CNN to the real M87* dirty image. The EHT found a ring diameter of \(42 \pm 3\) µas [1]. Given your results in part 2, should the CNN’s prediction for the real data be trusted, even if it happens to be close to this value? Explain.
# Your code here
Question 09#
(Optional) A calibration-independent approach. Closure phases are unaffected by station-based phase errors. Instead of images, use the closure phases on the triangles of the real observation as the input features.
For a few hundred simulated crescents observed with random station phases, compute the closure phases (
obs_sim.c_phases(mode='all', count='min', vtype='vis')) on the same triangles and times as the real data. Average the data first, e.g.obs_template.avg_coherent(600), to keep the number of features manageable. Encode each phase \(\psi\) as \((\cos\psi, \sin\psi)\).Train a regression model (e.g. a random forest or a small fully connected network) to predict the diameter, and evaluate it on held-out simulations.
Apply it to the closure phases of the real M87* data, and compare with \(42 \pm 3\) µas. Discuss the remaining sources of discrepancy, such as the model mismatch between simple crescents and the real source, a single observing day and band, and the training-set size.
# Your code here
Questions (Overview / Summary)#
Question 10#
Your CNN was trained purely on data. It has no knowledge of general relativity, radiative transfer, or the Kerr metric.
Write a short paragraph on:
What physical knowledge is nevertheless “baked into” your training pipeline? Think about how the training data were generated, including the dirty beam and the noise.
What did Question 08 teach you about applying a model trained on simulations to real data? Which differences between the simulations and the data mattered most?
What limitations would this approach have for a harder task, such as predicting the black hole spin (which has a subtler visual signature) from GRMHD images, instead of the diameter of simple crescents?
Suppose you added a physics-based penalty to the loss function, e.g. requiring the predicted diameter to be consistent with the Kerr shadow size for a given mass and distance. What extra information would you need, and how might it improve or constrain the network’s predictions?
# Your answer here
References#
[1] Event Horizon Telescope Collaboration, “First M87 Event Horizon Telescope Results. I. The Shadow of the Supermassive Black Hole,” Astrophys. J. Lett. 875, L1 (2019). doi:10.3847/2041-8213/ab0ec7
[2] Event Horizon Telescope Collaboration, “First Sagittarius A* Event Horizon Telescope Results. I. The Shadow of the Supermassive Black Hole in the Center of the Milky Way,” Astrophys. J. Lett. 930, L12 (2022). doi:10.3847/2041-8213/ac6674
[3] Event Horizon Telescope Collaboration, “First M87 Event Horizon Telescope Results. V. Physical Origin of the Asymmetric Ring,” Astrophys. J. Lett. 875, L5 (2019). doi:10.3847/2041-8213/ab0f43
[4] J. van der Gucht, J. Davelaar, L. Hendriks et al., “Deep Horizon: A machine learning network that recovers accreting black hole parameters,” Astron. Astrophys. 636, A94 (2020). doi:10.1051/0004-6361/201937014
[5] R. Qiu, A. Ricarte, R. Narayan et al., “Using Machine Learning to link black hole accretion flows with spatially resolved polarimetric observables,” Mon. Not. R. Astron. Soc. 520, 4867 (2023). doi:10.1093/mnras/stad466
[6] M. Raissi, P. Perdikaris, G. E. Karniadakis, “Physics-informed neural networks: A deep learning framework for solving forward and inverse problems involving nonlinear partial differential equations,” J. Comput. Phys. 378, 686 (2019). doi:10.1016/j.jcp.2018.10.045
[7] Event Horizon Telescope Collaboration, “First M87 Event Horizon Telescope Results. III. Data Processing and Calibration,” Astrophys. J. Lett. 875, L3 (2019). doi:10.3847/2041-8213/ab0c57
[8] A. A. Chael, M. D. Johnson, R. Narayan et al., “High-resolution Linear Polarimetric Imaging for the Event Horizon Telescope,” Astrophys. J. 829, 11 (2016). doi:10.3847/0004-637X/829/1/11. Code: achael/eht-imaging
[9] Event Horizon Telescope Collaboration, “First M87 Event Horizon Telescope Results. IV. Imaging the Central Supermassive Black Hole,” Astrophys. J. Lett. 875, L4 (2019). doi:10.3847/2041-8213/ab0e85
[10] L. Medeiros, D. Psaltis, T. R. Lauer, F. Özel, “The Image of the M87 Black Hole Reconstructed with PRIMO,” Astrophys. J. Lett. 947, L7 (2023). doi:10.3847/2041-8213/acc32d
[11] J. Y.-Y. Lin, D. W. Pesce, G. N. Wong et al., “VLBInet: Radio Interferometry Data Classification for EHT with Neural Networks,” arXiv:2110.07185 (2021). https://arxiv.org/abs/2110.07185
[12] A. R. Thompson, J. M. Moran, G. W. Swenson Jr., Interferometry and Synthesis in Radio Astronomy, 3rd ed. (Springer, 2017; open access). doi:10.1007/978-3-319-44431-4
Acknowledgements#
Initial version: Yuheng Guo with some guidance from Mark Neubauer
Revised: 2026
EHT SR1 data: Event Horizon Telescope Collaboration, data release 2019-D01-01
eht-imaging library: A. Chael et al.
© Copyright 2026