
Climate Model Neural Network Prediction#
Background#
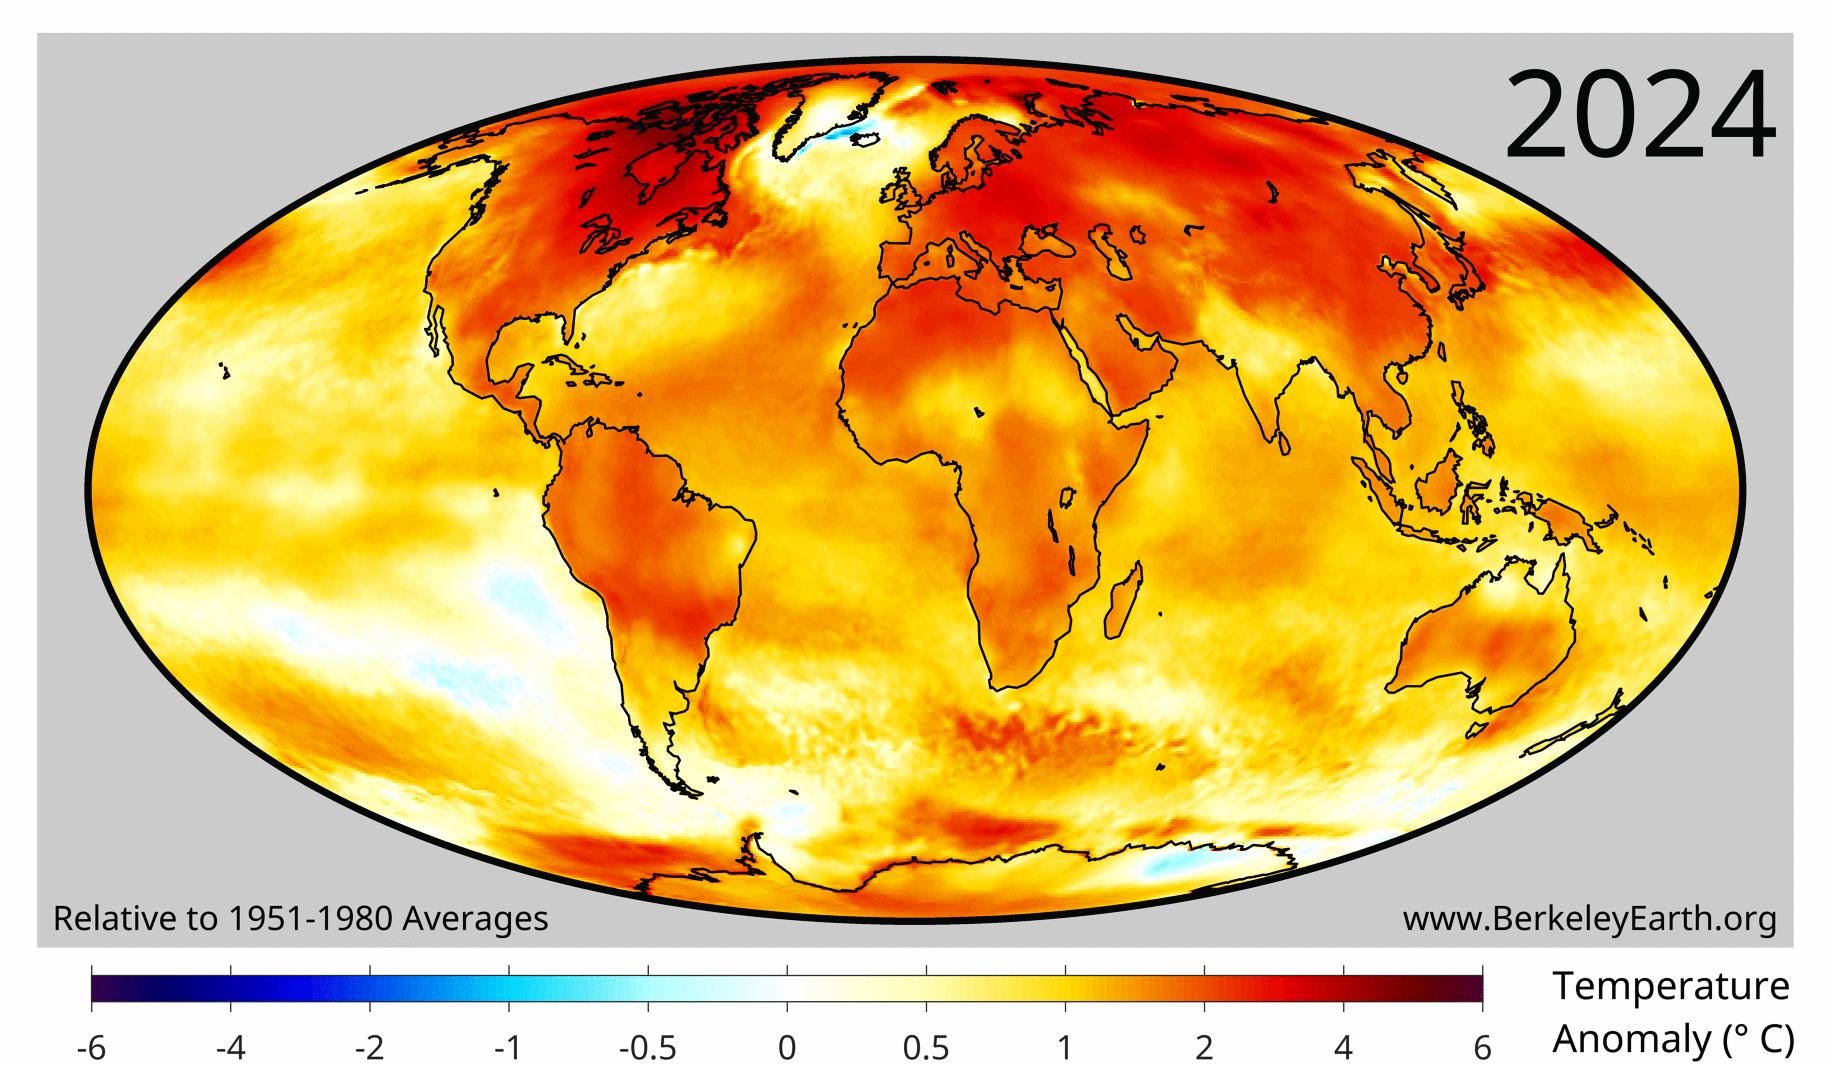
Climate change is one of the most important problems facing humanity in the years ahead, with numerous predicted regional or global changes, such as:
rising sea level [1];
increases in fire activity, fire risk, and burned area [2, 3, 4];
likely increases in hurricane intensity [5];
changes in the global atmospheric and oceanic circulation [6], with potentially severe impacts. For example, a collapse of the Atlantic overturning circulation in model experiments leads to strong cooling over the North Atlantic and Western Europe [7], although how much the circulation will actually weaken is uncertain [8].
Some of the most important tools used by climate scientists are computationally expensive numerical fluid-dynamics simulations called general circulation models (GCMs). They are used to predict and understand historical, future, or idealized climate scenarios: for example, an instantaneous quadrupling of \(CO_2\) [9], “aquaplanet” simulations of an Earth covered entirely by ocean [10], or “hosing” experiments, in which a large input of freshwater from melting ice is added to the ocean [7]. The Coupled Model Intercomparison Project (CMIP) coordinates a standard set of such simulations across the world’s modelling centres.
There are dozens of high-quality GCMs developed around the world. Four leading models in the United States are:
the Geophysical Fluid Dynamics Laboratory (GFDL) model, developed by the National Oceanic and Atmospheric Administration (NOAA) in collaboration with Princeton University;
the NASA Goddard Institute for Space Studies (GISS) model, developed with Columbia University;
the Department of Energy’s Energy Exascale Earth System Model (E3SM);
the Community Earth System Model (CESM) at the National Center for Atmospheric Research (NCAR).
Each modelling centre develops its own model, with different physical representations of processes, and together their simulations span much of the uncertainty in our understanding of the Earth system. Half of the 2021 Nobel Prize in Physics was awarded to Syukuro Manabe and Klaus Hasselmann, pioneers of climate modelling, “for the physical modelling of Earth’s climate, quantifying variability and reliably predicting global warming”. The next phase of CMIP, CMIP7, is under way, with all the major modelling centres producing new simulations with improved models and new experiments.
Overview#
This notebook has three goals:
learning to work with spatio-temporal climate-model output;
working with a small ensemble of climate models; and
training neural networks to predict monthly surface-temperature anomalies, and comparing them fairly with simple baselines.
Questions (Conceptual)#
Question 01#
What are some reasons different General Circulation Models (GCMs) produce different output?
Question 02#
Briefly explain what is meant by the resolution of a climate model.
Question 03#
What is the value of multiple models? Should efforts be focused on “one model to rule them all”? Explain the idea of model hierarchies and why they are useful [11]
Data Sources#
We now start working with model output. Climate-model output is extremely large, so it is common to select a subset by time, variable, or location. In addition, there are dozens of models, several simulations for each model, and different versions of the same model as it improves over time. Working with these “super-ensembles” is not feasible without high-performance computing (HPC) clusters. Fortunately, the community makes the simulation output relatively easy to access with limited resources, via the ESGF portal.
Downloading data#
wget scripts are the usual way to download climate-model output from ESGF; Globus is an alternative for large transfers. For this project we download two files directly. Both are historical simulations from CMIP3 [12], an earlier phase of the model intercomparison project:
GFDL CM2.0, historical simulation, monthly near-surface air temperature
tas, January 1861 – December 2000 (87 MB) [13]NCAR CCSM3.0, historical simulation, January 1870 – December 1999 (13 files of 16 MB, combined into one) [14]
Historical simulations reproduce the climate of the past ~150 years, driven by the historical changes in greenhouse gases and other forcings, such as aerosols and solar output (the forcings included differ somewhat between models). We first download the GFDL CM2.0 output.
%pip install --quiet cartopy netCDF4
# imports
import os
import urllib.request
import hashlib
import xarray as xr
import matplotlib.pyplot as plt
import cartopy.crs as ccrs
import cartopy.feature as cfeature
import glob as glob
import numpy as np
import warnings
warnings.filterwarnings('ignore')
# run this cell
url = "https://esgf-node.ornl.gov/thredds/fileServer/cmip3_data/data2/20c3m/atm/mo/tas/gfdl_cm2_0/run1/tas_A1.186101-200012.nc"
original_filename = "tas_A1.186101-200012.nc"
expected_hash = "f0a31b467db7449b8cb1172392d49153086749572a9547bef79a95bd3ce72724"

final_filename = "gfdl_cm2_1861_2000_historical_surfacetemperature.nc"

def verify_file(filepath, expected_hash):
    if not os.path.exists(filepath):
        return False
    sha256 = hashlib.sha256()
    with open(filepath, "rb") as f:
        for chunk in iter(lambda: f.read(4096), b""):
            sha256.update(chunk)
    return sha256.hexdigest() == expected_hash

if verify_file(final_filename, expected_hash) or verify_file(original_filename, expected_hash):
    print(f"File is already downloaded and verified.")
else:
    print(f"Downloading GFDL dataset...")
    urllib.request.urlretrieve(url, original_filename)

    # Verify the fresh download
    if verify_file(original_filename, expected_hash):
        print("Download complete and SHA256 verified!")
    else:
        print("Warning: File downloaded, but checksum failed.")

if os.path.exists(original_filename) and not os.path.exists(final_filename):
    os.rename(original_filename, final_filename)
    print(f"Renamed to: {final_filename}")

print("\nDone! Ready for analysis.")
Analyzing Climate Model Simulation (GFDL_CM2.0)#
After downloading the data we can subset and use some python libraries to help with the plotting.
# Here we open_dataset using xarray, then take the time mean
gfdl_hist = xr.open_dataset('gfdl_cm2_1861_2000_historical_surfacetemperature.nc')
# we can also subtract out 273.15 to make the Kelvin to Celsius conversion
gfdl_hist['tas'] = gfdl_hist['tas'] - 273.15
time_mean_gfdl_hist = gfdl_hist.mean("time")
time_mean_gfdl_hist.head()
time_mean_gfdl_hist is now a multidimensional xarray dataset, with lon and lat defining the spatial dimensions and tas giving the mean surface temperature values over the entire time domain. Xarray is a standard tool for working with climate data because it provides convenient built-in functionality for labeled multidimensional arrays. It draws on functionality from pandas and NumPy, and also supports more advanced workflows such as chunking and distributed computing.
Now we can plot the time mean over space with the below code:
fig, ax = plt.subplots(figsize=(8, 4))
im = time_mean_gfdl_hist.tas.plot(
    ax=ax,
    cmap="coolwarm",
    robust=True,
    vmin = -45,
    vmax= 30,
    cbar_kwargs={
        "label": "Surface temperature (C)",
        "shrink": 0.85,
        "pad": 0.03
    }
)
im.colorbar.set_label("Surface temperature (C)", labelpad=6)
ax.set_title("GFDL CM2.0 Historical Mean Surface Temperature", fontsize=14, pad=12)
ax.set_xlabel("Longitude")
ax.set_ylabel("Latitude")
ax.tick_params(labelsize=12)
plt.tight_layout()
We can also subset the dataset by time:
# isel is an index selection where 0 is the first index, up to index 3
multiple_times_select_by_time_gfdl = gfdl_hist.isel(time=[0,3])
# or for a single time
single_times_select_by_time_gfdl = gfdl_hist.isel(time=0)
Or we can group by year and look at a single year:
yearly_mean_gfdl_hist = gfdl_hist.groupby('time.year').mean()
single_year_gfdl_hist = yearly_mean_gfdl_hist.isel(year=0)
fig, ax = plt.subplots(figsize=(8, 4))
im = single_year_gfdl_hist.tas.plot(
    ax=ax,
    cmap="coolwarm",
    robust=True,
    vmin = -45,
    vmax= 30,
    cbar_kwargs={
        "label": "Surface temperature (C)",
        "shrink": 0.85,
        "pad": 0.03
    }
)
im.colorbar.set_label("Surface temperature (C)", labelpad=6)
ax.set_title(f"GFDL CM2.0 {int(single_year_gfdl_hist.year)} Mean Surface Temperature", fontsize=14, pad=12)
ax.set_xlabel("Longitude")
ax.set_ylabel("Latitude")
ax.tick_params(labelsize=12)
plt.tight_layout()
Questions (Computational Pt 1.)#
Question 04#
It is often more informative to look at temperature anomalies: for each location (and, for monthly data, each calendar month), compute the mean over a reference period, then subtract it. In the cell below, compute the mean over the first ~50 years of the simulation (1861–1910) at each grid cell, separately for each calendar month (groupby('time.month')). Subtract it from the entire simulation, and plot the annual-mean anomaly for the year 2000. Where is the warming largest?
Question 05#
Another common way to analyze spatio-temporal data is to map the linear trend. Group the data by year and compute the annual mean. Then fit a linear regression at each location and plot the resulting slope field, in °C per decade. np.polyfit accepts a 2D array of \(y\) values, so you can fit all grid cells at once. Looping over every longitude–latitude pair when the operation can be vectorized is bad practice. Where is the warming trend largest, and why might high northern latitudes warm faster (“Arctic amplification”)?
Neural Network for yearly predictions#
We are in the middle of a wave of exciting new research applying machine learning to problems in Earth, atmospheric, and climate science. A few especially notable recent projects include:
AI-based climate and weather models:
ML for climate-model parameterizations:
We will focus on a simple implementation of neural network to predict temperature. It will be helpful to learn to subset by location. The below code slices lon / lat to make a box over North America and demonstrates seasonality in the gfdl climate model.
tas_sub = gfdl_hist.sel(lat=slice(0, 80), lon=slice(220, 300))

fig, axes = plt.subplots(
    3, 4,
    figsize=(8, 6),
    subplot_kw={"projection": ccrs.PlateCarree()}, layout="constrained"
)
plt.suptitle(f'{tas_sub.isel(time=0).time.item().year} gfdl_hist', fontsize=18)
axes = axes.ravel()

for i in range(12):
    ax = axes[i]

    im = tas_sub.isel(time=i).tas.plot(
        ax=ax,
        transform=ccrs.PlateCarree(),
        vmin=-45,
        vmax=30,
        cmap="coolwarm",
        add_colorbar=False
    )

    ax.add_feature(cfeature.COASTLINE)
    ax.add_feature(cfeature.BORDERS, linewidth=1)
    ax.set_extent([220, 300, 0, 80], crs=ccrs.PlateCarree())

    t = tas_sub.isel(time=i).time.item()
    ax.set_title(f"month {t.month}")

cbar = fig.colorbar(im, ax=axes, orientation="vertical", fraction=0.04, pad=0.04)
cbar.set_label("surface air temperature C")
Questions (NN prediction)#
Question 06#
Implement a convolutional neural network (in PyTorch) that predicts the next month’s surface-temperature anomaly map over the North America box (lat 0–80°N, lon 220–300°E) from the anomaly maps of the previous \(k\) months (e.g. \(k = 3\), stacked as input channels). Use the anomalies from Question 04.
Split the data by time: train on the first 80% of the months and test on the last 20%. Why must we not split randomly?
Normalize the inputs and outputs using statistics from the training period only.
Baselines. Compare your CNN with simple baselines on the test period: (a) climatology, i.e. predicting zero anomaly; (b) persistence, i.e. predicting that next month’s anomaly equals this month’s; and (c) a per-grid-cell linear autoregression, \(A_{t+1} = \phi\,A_t\), with \(\phi\) fitted on the training period.
Report the test RMSE of each method, and map the RMSE of the CNN spatially.
Plot the time series of the true (climate-model) and CNN-predicted anomalies over the test period at the grid point closest to Champaign, IL (40.1°N, 88.2°W, i.e. lon ≈ 271.8°E), using
dataset.sel(lat=..., lon=..., method="nearest").
How much better than the baselines does the CNN do? What does this tell you about the predictability of monthly temperature anomalies, i.e. weather noise versus forced climate change?
# Your code here
Questions (NN prediction (2 members))#
Run the next cell to download one other climate model output.
# saves as one file, only run cell once
datasets = [
    ("tas_A1.20C3M_1.CCSM.atmm.1980-01_cat_1989-12.nc", "https://esgf-node.ornl.gov/thredds/fileServer/cmip3_data/data2/20c3m/atm/mo/tas/ncar_ccsm3_0/run1/tas_A1.20C3M_1.CCSM.atmm.1980-01_cat_1989-12.nc", "8d0822cdf36f97928bc199c1ffcce0f70f5f61befb4aa3a223883feba2120af3"),
    ("tas_A1.20C3M_1.CCSM.atmm.1910-01_cat_1919-12.nc", "https://esgf-node.ornl.gov/thredds/fileServer/cmip3_data/data2/20c3m/atm/mo/tas/ncar_ccsm3_0/run1/tas_A1.20C3M_1.CCSM.atmm.1910-01_cat_1919-12.nc", "ae8c49cd4c9bb930744babea7f399fc49a56d9b195d3c4815ecb60ccdb234088"),
    ("tas_A1.20C3M_1.CCSM.atmm.1940-01_cat_1949-12.nc", "https://esgf-node.ornl.gov/thredds/fileServer/cmip3_data/data2/20c3m/atm/mo/tas/ncar_ccsm3_0/run1/tas_A1.20C3M_1.CCSM.atmm.1940-01_cat_1949-12.nc", "54f68a930e89849570ec6749985f0ded1f385c1d8199b869e49f646730de821d"),
    ("tas_A1.20C3M_1.CCSM.atmm.1950-01_cat_1959-12.nc", "https://esgf-node.ornl.gov/thredds/fileServer/cmip3_data/data2/20c3m/atm/mo/tas/ncar_ccsm3_0/run1/tas_A1.20C3M_1.CCSM.atmm.1950-01_cat_1959-12.nc", "204f3cbb05ae1add8e85ee5b4cd0406847ceb59ea480db892ec80e5dcce9de65"),
    ("tas_A1.20C3M_1.CCSM.atmm.1900-01_cat_1909-12.nc", "https://esgf-node.ornl.gov/thredds/fileServer/cmip3_data/data2/20c3m/atm/mo/tas/ncar_ccsm3_0/run1/tas_A1.20C3M_1.CCSM.atmm.1900-01_cat_1909-12.nc", "3b00c20efae648251a5fdefdabbfa80526b1280efa3e3566ecf6ec41dcde4b57"),
    ("tas_A1.20C3M_1.CCSM.atmm.1930-01_cat_1939-12.nc", "https://esgf-node.ornl.gov/thredds/fileServer/cmip3_data/data2/20c3m/atm/mo/tas/ncar_ccsm3_0/run1/tas_A1.20C3M_1.CCSM.atmm.1930-01_cat_1939-12.nc", "ec2b145490f3c7e920525d0934107a80a4a7552794c872cc74f9447f8dd8dc36"),
    ("tas_A1.20C3M_1.CCSM.atmm.1970-01_cat_1979-12.nc", "https://esgf-node.ornl.gov/thredds/fileServer/cmip3_data/data2/20c3m/atm/mo/tas/ncar_ccsm3_0/run1/tas_A1.20C3M_1.CCSM.atmm.1970-01_cat_1979-12.nc", "8f26731776d2fac6d54515cca8aa72ad847d9d33cfd91f6ebc27c63b17124189"),
    ("tas_A1.20C3M_1.CCSM.atmm.1870-01_cat_1879-12.nc", "https://esgf-node.ornl.gov/thredds/fileServer/cmip3_data/data2/20c3m/atm/mo/tas/ncar_ccsm3_0/run1/tas_A1.20C3M_1.CCSM.atmm.1870-01_cat_1879-12.nc", "23b9f725d311a955454fa86f98a5c8743fd5e27bb12d1b402ac68d3f67e1e26d"),
    ("tas_A1.20C3M_1.CCSM.atmm.1890-01_cat_1899-12.nc", "https://esgf-node.ornl.gov/thredds/fileServer/cmip3_data/data2/20c3m/atm/mo/tas/ncar_ccsm3_0/run1/tas_A1.20C3M_1.CCSM.atmm.1890-01_cat_1899-12.nc", "32b8ac00c83204c203452e05dbedb0132bda81c623f2a0a521c851e48ae82068"),
    ("tas_A1.20C3M_1.CCSM.atmm.1920-01_cat_1929-12.nc", "https://esgf-node.ornl.gov/thredds/fileServer/cmip3_data/data2/20c3m/atm/mo/tas/ncar_ccsm3_0/run1/tas_A1.20C3M_1.CCSM.atmm.1920-01_cat_1929-12.nc", "9c3d344ff505d7702fb68f2cdc52972a97a3c3b15c4fefafac968135d6713b34"),
    ("tas_A1.20C3M_1.CCSM.atmm.1960-01_cat_1969-12.nc", "https://esgf-node.ornl.gov/thredds/fileServer/cmip3_data/data2/20c3m/atm/mo/tas/ncar_ccsm3_0/run1/tas_A1.20C3M_1.CCSM.atmm.1960-01_cat_1969-12.nc", "0e21367263d1016d15d225ca01747143f67dcbe9be9af2f1b112e193c9bcd297"),
    ("tas_A1.20C3M_1.CCSM.atmm.1990-01_cat_1999-12.nc", "https://esgf-node.ornl.gov/thredds/fileServer/cmip3_data/data2/20c3m/atm/mo/tas/ncar_ccsm3_0/run1/tas_A1.20C3M_1.CCSM.atmm.1990-01_cat_1999-12.nc", "ab5a096e51ed997cfd1b05a0f95ddbc566bdf22aa4f6c60e6c504118887141e1"),
    ("tas_A1.20C3M_1.CCSM.atmm.1880-01_cat_1889-12.nc", "https://esgf-node.ornl.gov/thredds/fileServer/cmip3_data/data2/20c3m/atm/mo/tas/ncar_ccsm3_0/run1/tas_A1.20C3M_1.CCSM.atmm.1880-01_cat_1889-12.nc", "b77578c2b170c05609fc8f76c49ca2698bdce030572136e72774d080a0732b88")
]

def verify_file(filepath, expected_hash):
    if not os.path.exists(filepath):
        return False
    sha256 = hashlib.sha256()
    with open(filepath, "rb") as f:
        for chunk in iter(lambda: f.read(4096), b""):
            sha256.update(chunk)
    return sha256.hexdigest() == expected_hash

file_list = []
print("--- Starting Downloads ---")
for filename, url, expected_hash in datasets:
    file_list.append(filename)

    if verify_file(filename, expected_hash):
        print(f"[{filename}] Verified. Skipping download.")
    else:
        print(f"[{filename}] Downloading...")
        urllib.request.urlretrieve(url, filename)

print("\n--- Combining Data with xarray ---")
final_filename = 'ncar_ccsm30_1870_2000_historical_surfacetemperature.nc'

try:
    ccsm = xr.open_mfdataset(sorted(file_list))
    ccsm.to_netcdf(final_filename)
    ccsm.close()
    print(f"Successfully saved combined dataset to: {final_filename}")
    print("\n--- Cleaning Up ---")
    for f in file_list:
        if os.path.exists(f):
            os.remove(f)
            print(f"Deleted chunk: {f}")

    print("\nAll done!")

except Exception as e:
    print(f"\nAn error occurred during xarray processing: {e}")
    print("Skipping cleanup so you can inspect the chunk files.")
Question 07#
Climate models from different modelling centres provide their output differently: with different resolutions, grids, variable names or conventions, which can make working with them cumbersome. GFDL CM2.0 uses a 2.5° × 2° longitude–latitude grid, while NCAR CCSM3.0 uses a finer (T85, about 1.4°) grid.
Regrid the NCAR CCSM output onto the GFDL grid, and create one xarray dataset with the variables gfdl_tas and ccsm_tas over their common period (1870–1999). You can use xarray’s interp, or the xesmf package if you have it (it is easiest to install with conda). Check for missing values after regridding, e.g. near the poles or at the 0°/360° longitude seam, and handle them.
# Your code here
Question 08#
Now use the two climate models to test how well your approach generalizes.
Train the CNN of Question 06 on GFDL and test it on CCSM over the same test period, and vice versa. Does a network trained on one model’s “world” work on the other model’s? Compare with the baselines on each model.
Train one CNN on both models together (e.g. as two separate sets of training samples), and evaluate it on each.
Compare the predicted and the simulated anomalies of both models at the Champaign grid point. What does the difference between the two climate models tell you about model uncertainty?
# Your code here
Questions (Overview / Summary)#
Question 09#
Write a short paragraph on one of the projects / advances from above. Talk about the relative importance, the training, and the architecture. What are some of the main benefits of ML methods in earth sciences?
References#
[1] Church, J. A., & White, N. J. (2006). A 20th century acceleration in global sea-level rise. Geophysical Research Letters, 33(1). https://doi.org/10.1029/2005GL024826
[2] Goss, M., Swain, D. L., Abatzoglou, J. T., Sarhadi, A., Kolden, C. A., Williams, A. P., & Diffenbaugh, N. S. (2020). Climate change is increasing the likelihood of extreme autumn wildfire conditions across California. Environmental Research Letters, 15(9), 094016. https://doi.org/10.1088/1748-9326/ab83a7
[3] Abatzoglou, J. T., Williams, A. P., & Barbero, R. (2019). Global Emergence of Anthropogenic Climate Change in Fire Weather Indices. Geophysical Research Letters, 46(1), 326–336. https://doi.org/10.1029/2018GL080959
[4] Abatzoglou, J. T., & Williams, A. P. (2016). Impact of anthropogenic climate change on wildfire across western US forests. Proceedings of the National Academy of Sciences, 113(42), 11770–11775. https://doi.org/10.1073/pnas.1607171113
[5] Knutson, T. R., Chung, M. V., Vecchi, G., Sun, J., Hsieh, T.-L., & Smith, A. J. P. (2021). Climate change is probably increasing the intensity of tropical cyclones. NOAA Climate.gov. https://www.climate.gov/news-features/understanding-climate/climate-change-probably-increasing-intensity-tropical-cyclones
[6] Shaw, T. A., Arblaster, J. M., Birner, T., Butler, A. H., Domeisen, D. I. V., Garfinkel, C. I., Garny, H., Grise, K. M., & Karpechko, A. Yu. (2024). Emerging Climate Change Signals in Atmospheric Circulation. AGU Advances, 5(6), e2024AV001297. https://doi.org/10.1029/2024AV001297
[7] Manabe, S., & Stouffer, R. J. (1995). Simulation of abrupt climate change induced by freshwater input to the North Atlantic Ocean. Nature, 378(6553), 165–167. https://doi.org/10.1038/378165a0
[8] Bonan, D. B., Thompson, A. F., Schneider, T., Zanna, L., Armour, K. C., & Sun, S. (2025). Observational constraints imply limited future Atlantic meridional overturning circulation weakening. Nature Geoscience, 18(6), 479–487. https://doi.org/10.1038/s41561-025-01709-0
[9] Andrews, T., Gregory, J. M., Webb, M. J., & Taylor, K. E. (2012). Forcing, feedbacks and climate sensitivity in CMIP5 coupled atmosphere‐ocean climate models. Geophysical Research Letters, 39(9), 2012GL051607. https://doi.org/10.1029/2012GL051607
[10] Hayashi, Y.-Y., & Sumi, A. (1986). The 30-40 Day Oscillations Simulated in an “Aqua Planet” Model. Journal of the Meteorological Society of Japan. Ser. II, 64(4), 451–467. https://doi.org/10.2151/jmsj1965.64.4_451
[11] Maher, P., Gerber, E. P., Medeiros, B., Merlis, T. M., Sherwood, S., Sheshadri, A., Sobel, A. H., Vallis, G. K., Voigt, A., & Zurita-Gotor, P. (2019). Model Hierarchies for Understanding Atmospheric Circulation. Reviews of Geophysics, 57(2), 250–280. https://doi.org/10.1029/2018RG000607
[12] Meehl, G. A., Covey, C., Delworth, T., Latif, M., McAvaney, B., Mitchell, J. F. B., Stouffer, R. J., & Taylor, K. E. (2007). THE WCRP CMIP3 Multimodel Dataset: A New Era in Climate Change Research. Bulletin of the American Meteorological Society, 88(9), 1383–1394. https://doi.org/10.1175/BAMS-88-9-1383
[13] Delworth, T. L., Broccoli, A. J., Rosati, A., Stouffer, R. J., Balaji, V., Beesley, J. A., Cooke, W. F., Dixon, K. W., Dunne, J., Dunne, K. A., Durachta, J. W., Findell, K. L., Ginoux, P., Gnanadesikan, A., Gordon, C. T., Griffies, S. M., Gudgel, R., Harrison, M. J., Held, I. M., … Zhang, R. (2006). GFDL’s CM2 Global Coupled Climate Models. Part I: Formulation and Simulation Characteristics. Journal of Climate, 19(5), 643–674. https://doi.org/10.1175/JCLI3629.1
[14] Collins, W. D., Bitz, C. M., Blackmon, M. L., Bonan, G. B., Bretherton, C. S., Carton, J. A., Chang, P., Doney, S. C., Hack, J. J., Henderson, T. B., Kiehl, J. T., Large, W. G., McKenna, D. S., Santer, B. D., & Smith, R. D. (2006). The Community Climate System Model Version 3 (CCSM3). Journal of Climate, 19(11), 2122–2143. https://doi.org/10.1175/JCLI3761.1
[15] Duncan, J. P. C., Wu, E., Dheeshjith, S., Subel, A., Arcomano, T., Clark, S. K., Henn, B., Kwa, A., McGibbon, J., Perkins, W. A., Gregory, W., Fernandez-Granda, C., Busecke, J., Watt-Meyer, O., Hurlin, W. J., Adcroft, A., Zanna, L., & Bretherton, C. (2026). SamudrACE: Fast and Accurate Coupled Climate Modeling with 3D Ocean and Atmosphere Emulators (arXiv:2509.12490; Version 2). arXiv. https://doi.org/10.48550/arXiv.2509.12490
[16] Kochkov, D., Yuval, J., Langmore, I., Norgaard, P., Smith, J., Mooers, G., Klöwer, M., Lottes, J., Rasp, S., Düben, P., Hatfield, S., Battaglia, P., Sanchez-Gonzalez, A., Willson, M., Brenner, M. P., & Hoyer, S. (2024). Neural general circulation models for weather and climate. Nature, 632(8027), 1060–1066. https://doi.org/10.1038/s41586-024-07744-y
[17] Lam, R., Sanchez-Gonzalez, A., Willson, M., et al. (2023). Learning skillful medium-range global weather forecasting. Science, 382(6677), 1416–1421. https://doi.org/10.1126/science.adi2336
[18] Schmude, J., Roy, S., Trojak, W., Jakubik, J., Civitarese, D. S., Singh, S., Kuehnert, J., Ankur, K., Gupta, A., Phillips, C. E., Kienzler, R., Szwarcman, D., Gaur, V., Shinde, R., Lal, R., Silva, A. D., Diaz, J. L. G., Jones, A., Pfreundschuh, S., … Ramachandran, R. (2024). Prithvi WxC: Foundation Model for Weather and Climate (arXiv:2409.13598). arXiv. https://doi.org/10.48550/arXiv.2409.13598
Acknowledgements#
Initial version: Theo Avila with some guidance from Mark Neubauer
Revised: 2026
CMIP3 model output: WCRP CMIP3 multi-model dataset, accessed through ESGF (ORNL node)
© Copyright 2026